Our fieldwork consists of recording feeding fish on video, then capturing them (or their neighbors, if necessary) and harmlessly collecting their stomach contents to see what they ate during our observations. We’ll then compare these data with model predictions. We take photos of each fish we stomach sample, from both sides, so we can compare their appearances (spots, parr marks, scars, etc.) and see which stomach samples correspond to which fish we observed on video.
We also accomplish two tasks at once by photographing each fish against a ruler-like grid to measure its length. We started out with a storebought 1/8-inch grid (pink in the pictures), but then used custom black and white metric grids for most of the summer (with progressively thicker marks at 1, 10, and 100 mm).
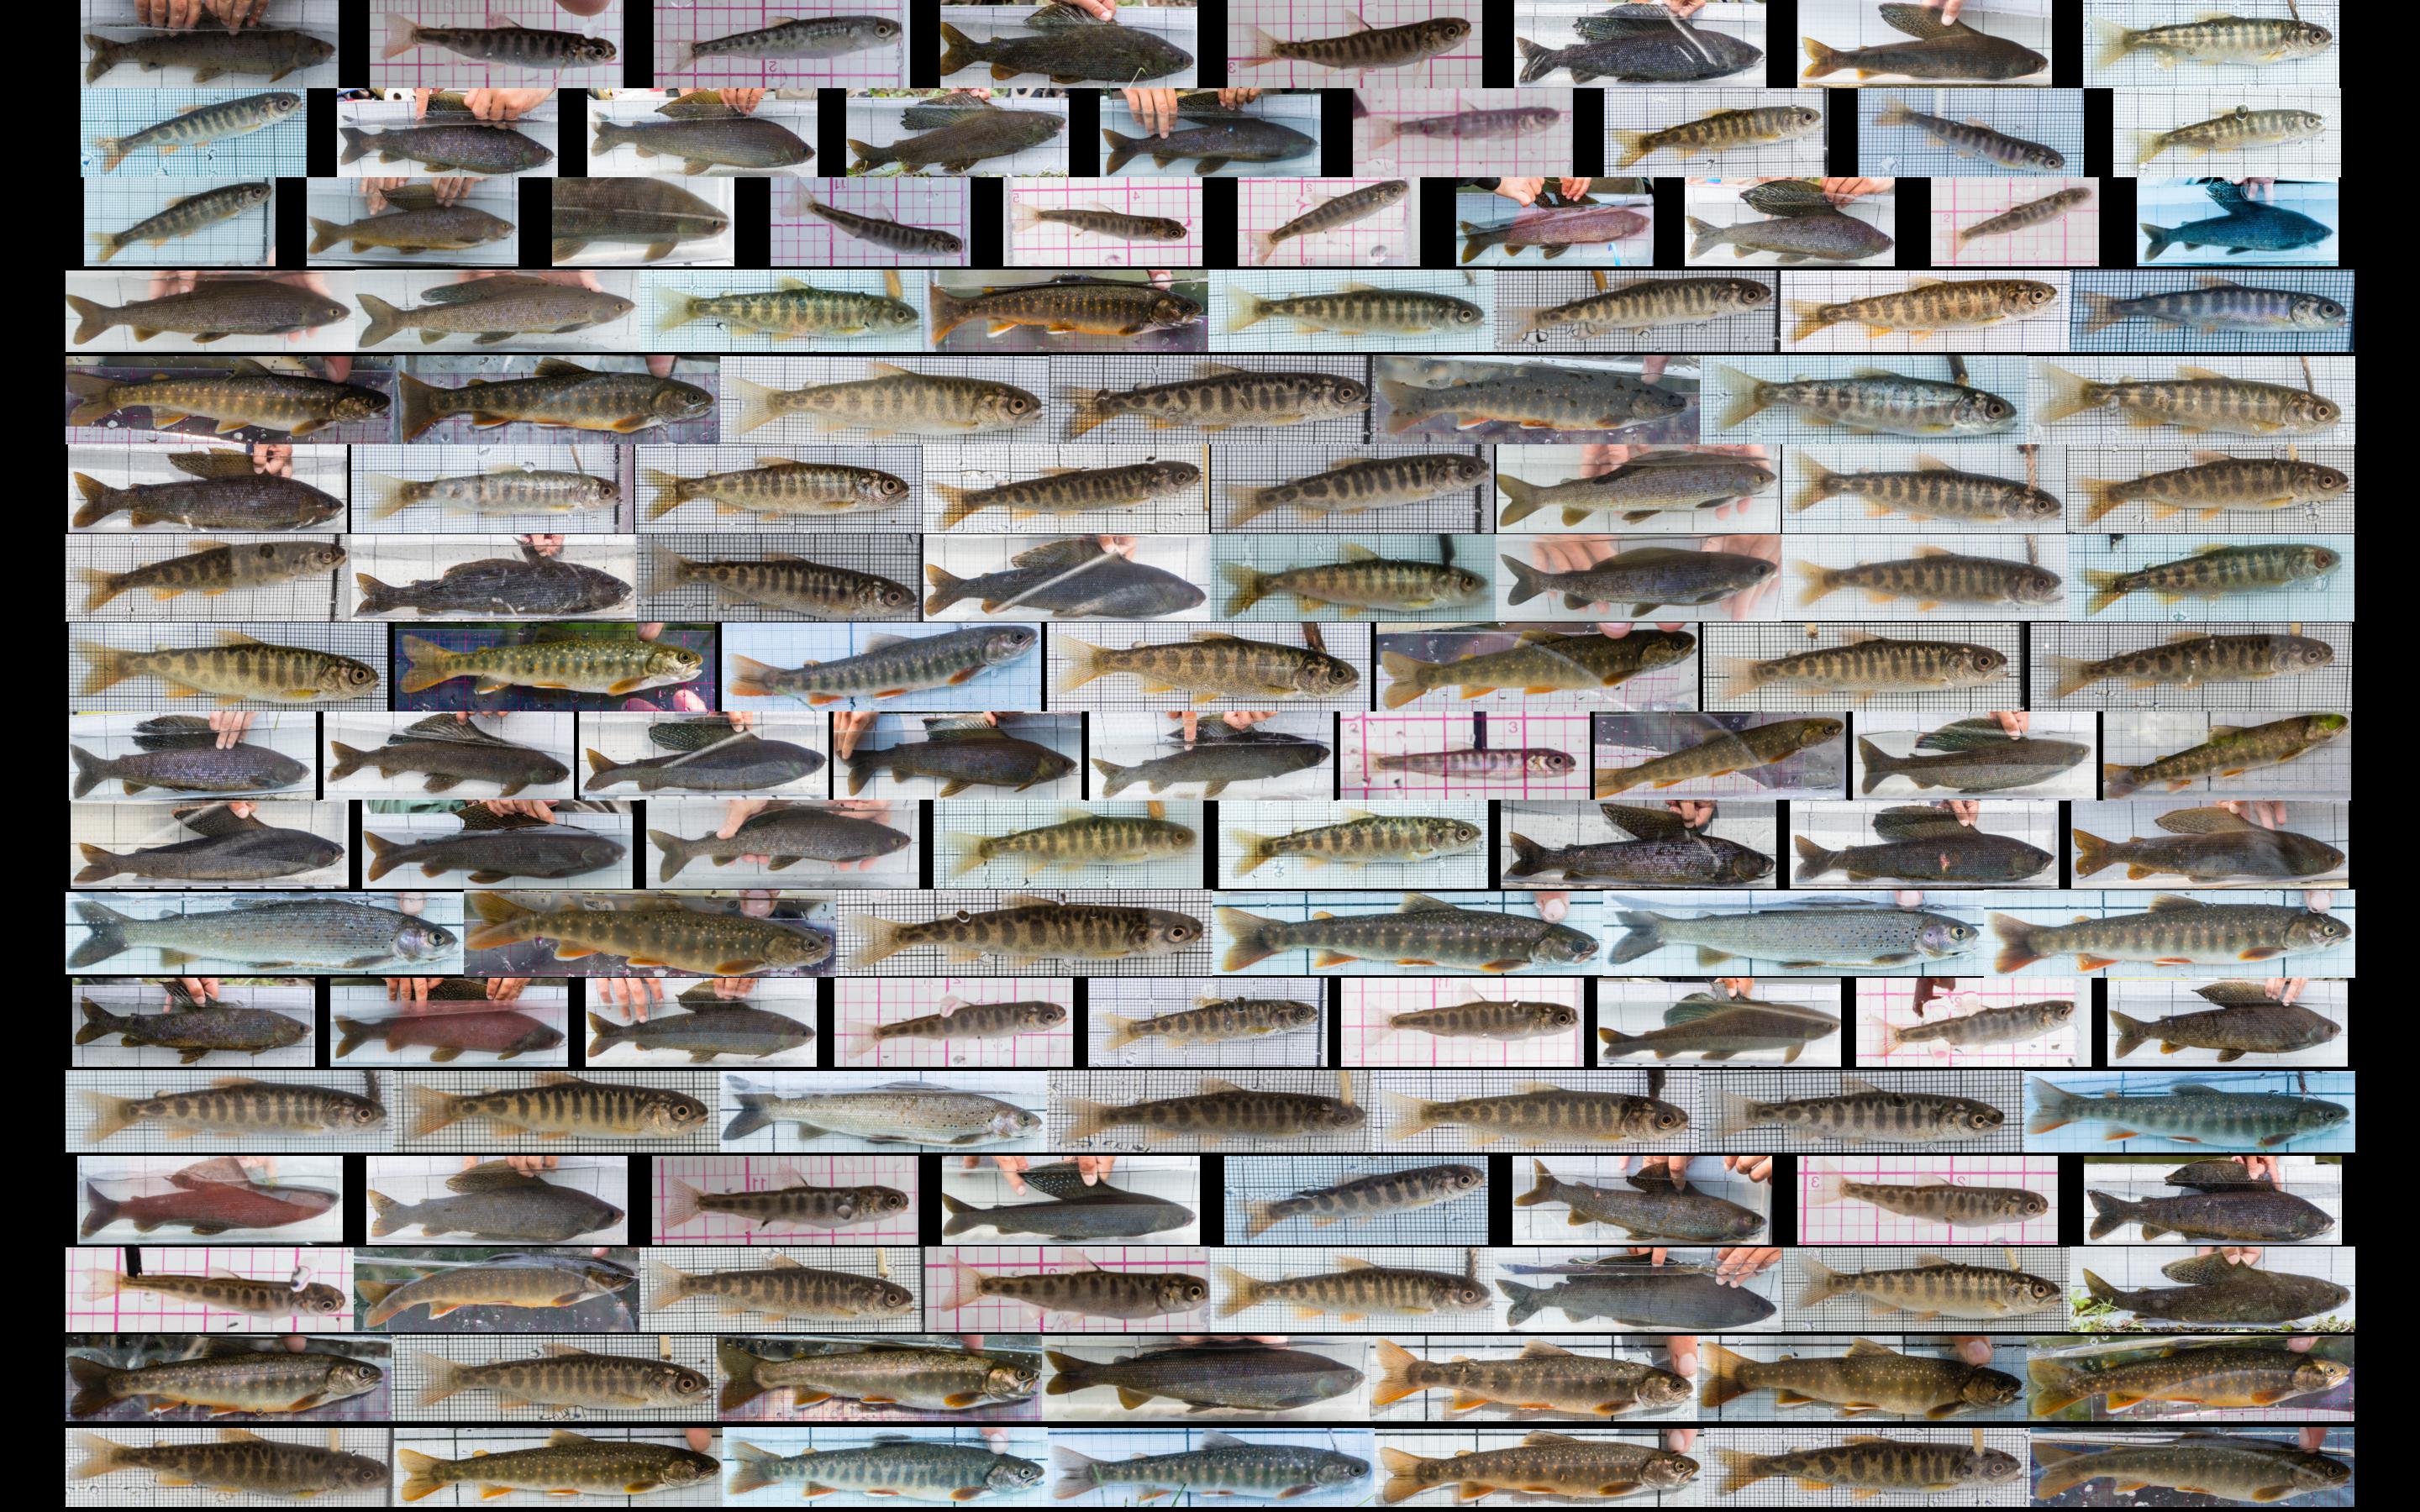
After using photo software (Lightroom) to crop/straighten all the fish images and add metadata (such as species, length, and left/right view) I sent the whole batch to Mathematica to organize all the metadata into spreadsheets and generate some graphics. Here are all the fish we physically sampled this summer, from the left (click the image to see it full-size):
 And the other side of all the same fish:
 And here are collages of each species, with image size being proportional to the size of the fish. Juvenile Chinook salmon:
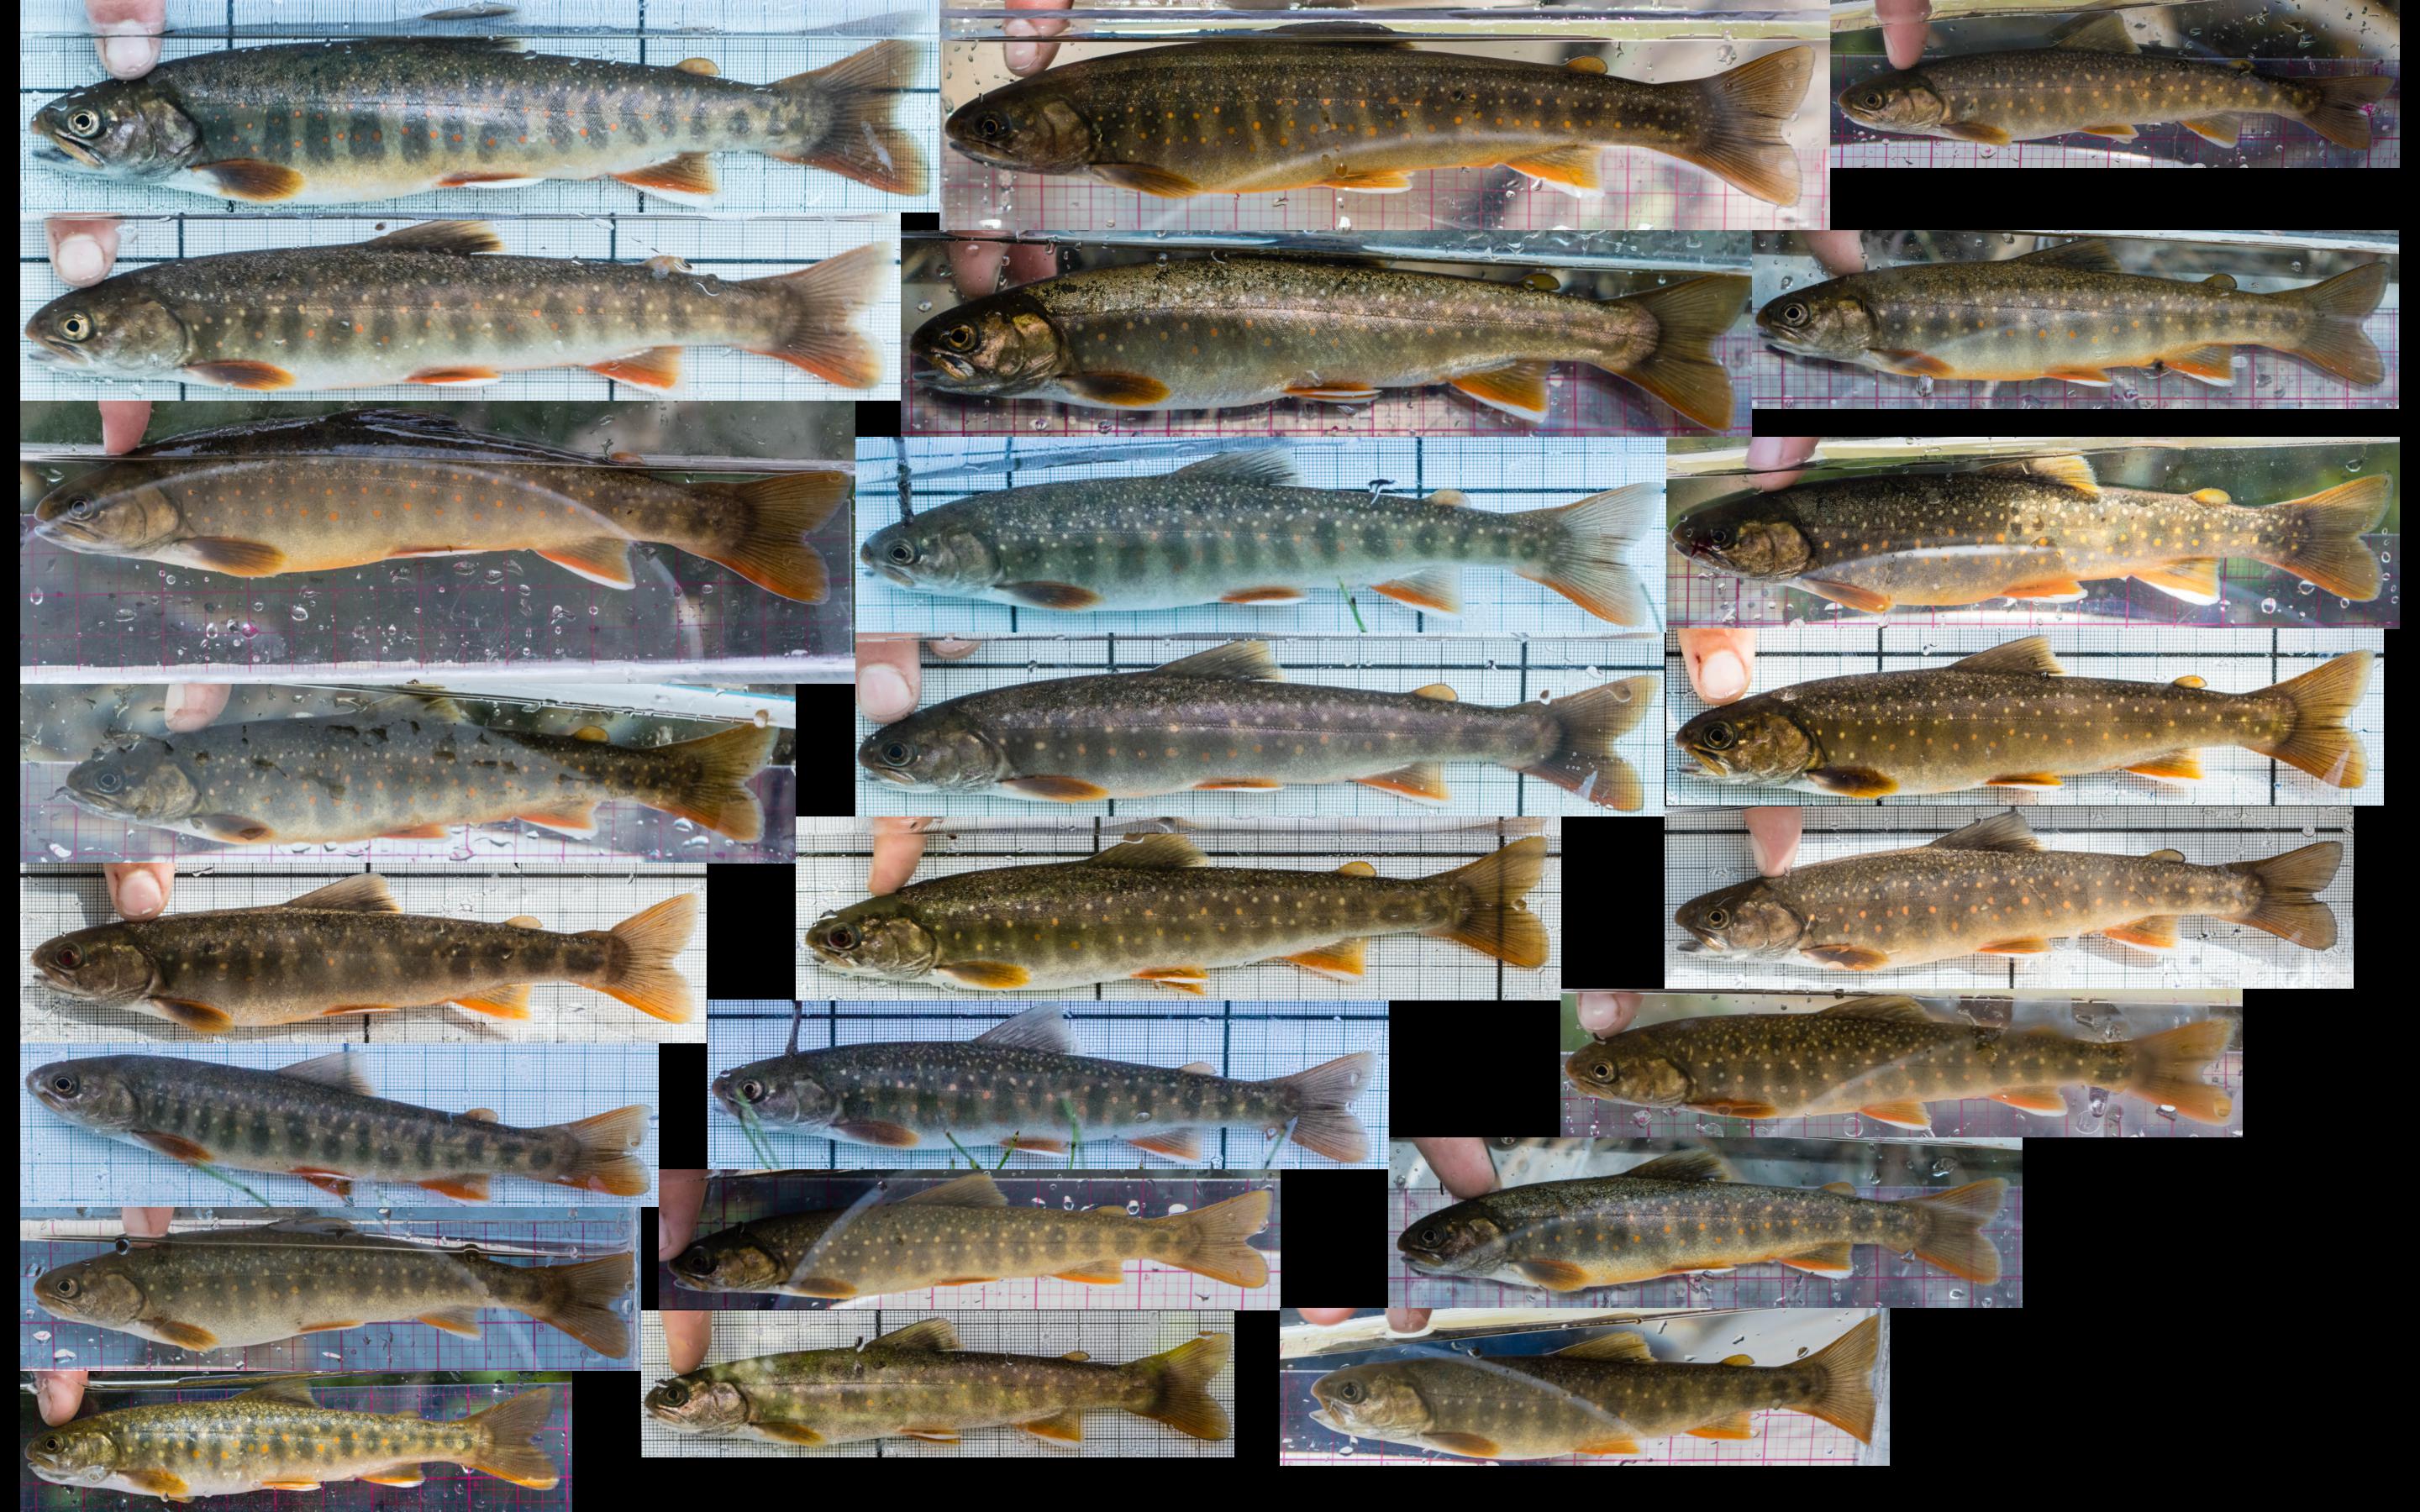
 Dolly varden:
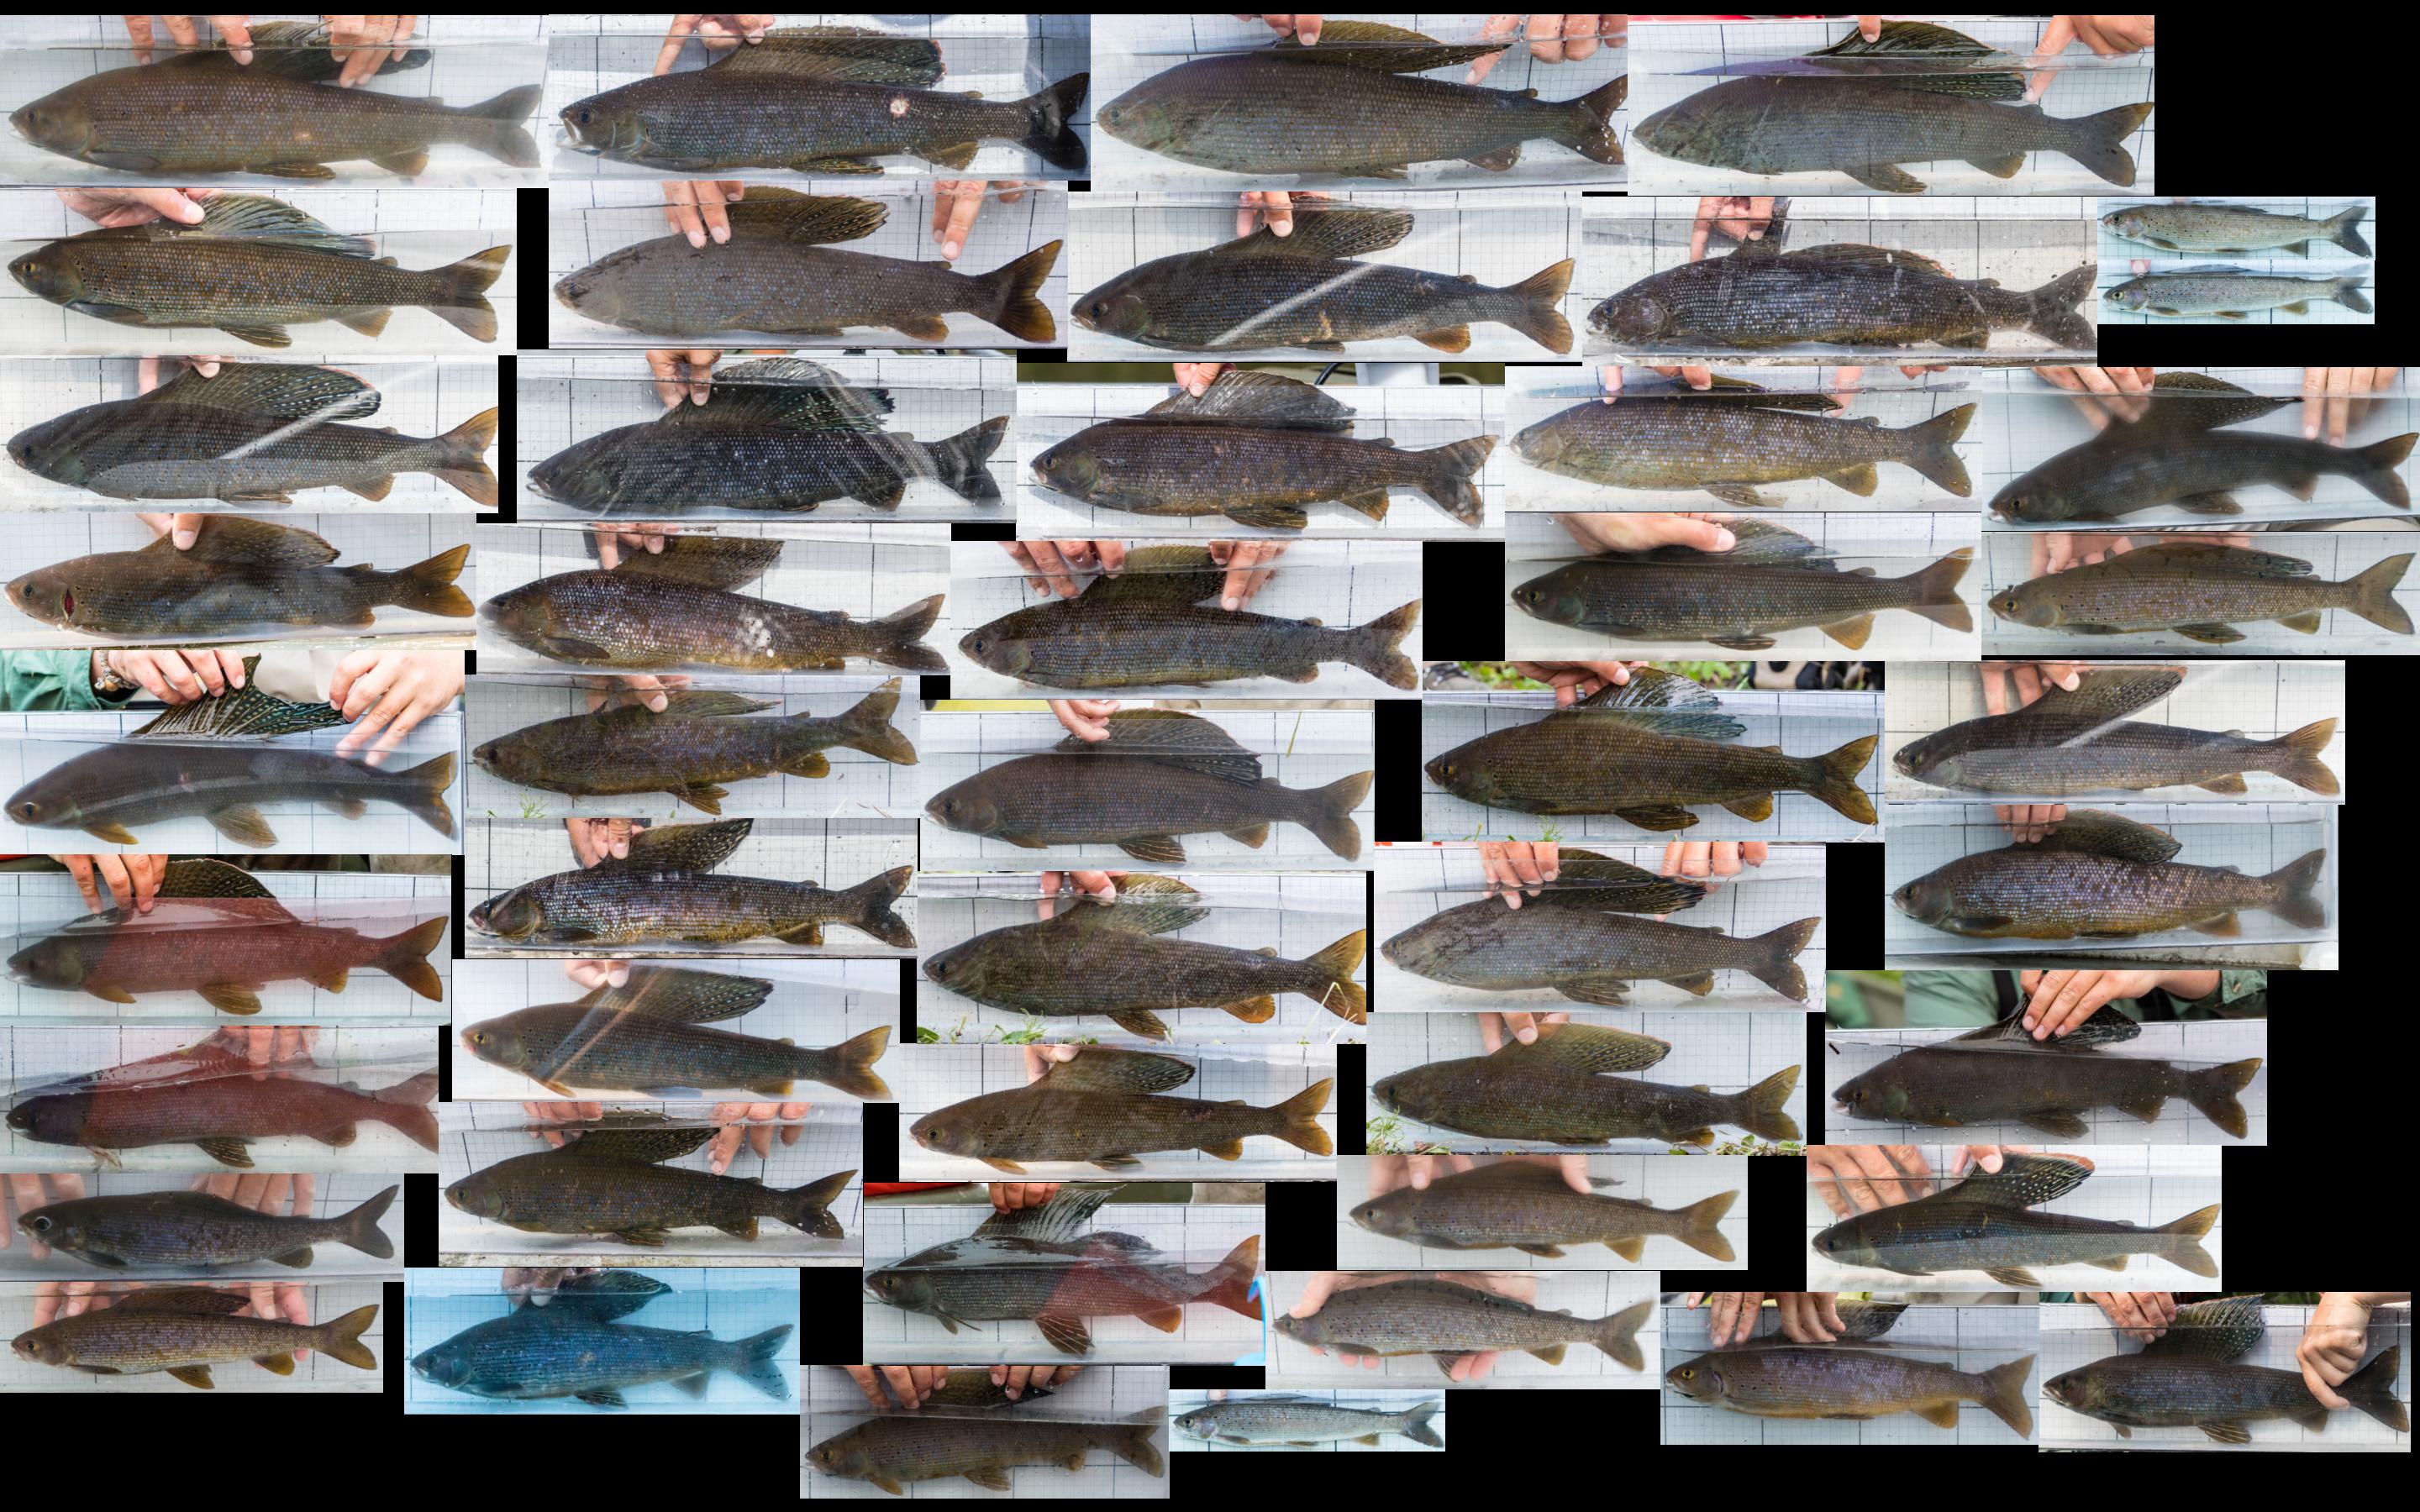
 Arctic grayling:
 The above images are mostly just for fun. The main application of these images, besides length measurement, is to group them into “reference cards” for comparing fish on video to the fish we caught at each of our 31 study sites. Here are a couple of those, showing each fish from both sides: